Fantasy Football Stats 2013 – Offense (FantasyCube.com) Aug28b
With the increasing popularity of the NFL’s Fantasy Football League many people are trying to get the upper hand in their own respectable leagues whether it is from NFL analyst, sports articles, or just a gut feeling from looking at statistics on your own or with a group of friends. Using a regression model of the statistics of every 2012 quarterback and Yahoo predictions I am able to demonstrate an example of using analytics could be potentially useful when preparing for a fantasy draft.
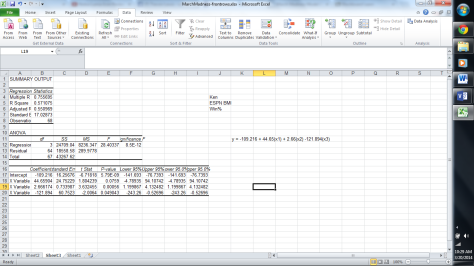
I built a regression model from three well known quarterback statistical categories which were passing yards, touchdowns, and interceptions against Yahoo’s predicted picks. The model was more accurate than many other potential models having an R Squared value of .04. The variables held t values of 13.46, -.74, -.72, and 1.83. The p values were 2.1e-31, .456, .470, and .068. The data was also significant in the sense that its significant f value was .0156 and the f value was 3.522.
With the use of bar charts I am able to effectively show the three variables I chose (P. Yards, TD, Int) against the Yahoo predicted draft picks. While the interception chart doesn’t look like it effectively shows anything meaningful it is still important when using all of the variables together.